Warning

Warning: This site contains images and graphic descriptions of extreme violence and/or its effects. It's not as bad as it could be, but is meant to be shocking. Readers should be 18+ or a mature 17 or so. There is also some foul language occasionally, and potential for general upsetting of comforting conventional wisdom. Please view with discretion.

Thursday, April 30, 2020

COVID19: UK Peak in Mid-March?

April 30, 2020
rough, incomplete

COVID19 lockdown critics in the UK have frequently argued that infection rates or related deaths
had "peaked" very early, in mid-March. I've encountered four reasons to say this, as offered by three experts some find trustworthy, and by circumstance:

1) Prof. Paul Heneghan called peak infections on 3-16 because it's 21 days before peak deaths on 4-8 and he notes infection rates of some kind halved after that.

2) Isaac Ben-Israel decided the virus spreads to a peak in 40 days, declines to near zero in 70 days, no matter where or what people do. By that, UK peak infections would be around March 13.

3) Math hoaxer Andrew Mather finds March 16 has the highest increase of … daily total death vs. prior total given as a percentage? ... which ... means something? This is the one I consider in most detail here.

4) What I suspect is the real reason: A peak then would be just before social distancing suggestions gave way, between Mach 18 and 23, to the controversial lockdown of most commerce and stern admonitions to "stay home, save lives". They and/or their fans in the public wanted to see the crisis set to resolve naturally before lockdown, to prove that hated policy was a scam they can look heroic for fighting, or even that, as 21st Century Wire put it, UK Ministers "knew" the pandemic was wrapping up when they acted, clearly for some other reason.

1) Carl Heneghan is the Director of the Centre for Evidence-Based Medicine, based at Oxford University, and professor of same, at the same. I don't know how well he handles evidence to base medicine on, aside from these arguments about COVID19, and that doesn't seem encouraging. But his center is at Oxford, not in some strip-mall, so maybe I'm missing something.

Back on March 11 at just 456 cases and eight deaths in the UK, Henegan noted "the seasonal peak in winter respiratory illnesses has occurred; the normal year on year trend would see a continued downturn in infections and deaths. However, it is too early to tell: the next few weeks will determine whether the trend for a reduction in deaths is maintained, or whether the Covid-19 outbreak takes hold and leads to more infections and rising mortality." A few weeks later, we could see it had taken hold, but he seems to argue it had peaked about then and was declining, as cited in a Daily Mail article of April 20: "[Heneghan] refers to a delay in the time it takes for an infected person to fall seriously ill and die - three weeks on average. He claims that if the Government accepts that deaths peaked on April 8, then it must mean that infections were at their highest around three weeks prior." He presumes that was a high, IF the 8 April peak was a real high (the 10th was the actual peak: 980 dead in one day) followed by a real decline (followed, with a long delay, staying around 800/day on average for nearly two weeks after - that whole thing is the long peak, IF there's just one peak). If March 16 was the peak of new cases (it wasn't), then rates would have dropped since then, and logically might continue. There's no mention of his checking actual data and seeing such a drop, and as it happens there isn't one.

The time he guesses should be around March 15-16, and the 16th came up especially as a point where rates of something dropped, which is taken as suppoting the guess. "Data shows the rate of Britons with upper respiratory tract infections dropped from 20 per 100,000 people on March 15 to around 12 per 100,000 just six days later. The figures do not relate solely to coronavirus but may be a good indicator because so few people were being tested for the deadly infection." That's clearly lame, and apparently the figures don't relate AT ALL to COVID19. The article included this image, captioned "Royal College of GP data shows the number of people with flu-like illness in England and Wales dropped by 50 per cent when hand-washing and social distancing was encouraged on March 16. Professor Heneghan says this is evidence full lockdown was not necessary." In fact the same vague numbers (green line) show coronavirus cases increasing sharply at the same time - presumably less sharply than they would have, but still rising to 5 per 10,000. I haven't checked this against the data, but the flat week April 5-12 looks perhaps too flat, and I don't know about the start and the rise, but it's clear there was a rise abut then, while prof. Heneghan insisted it "must" have started declining then.

But it turns out there's a kind of COVID19 infections number - one of no relevance - that DID roughly halve after the 16th. We'll come back to that in point 3.

2) Times of Israel reported on April 14 the findings of Isaac Ben-Israel, "a prominent Israeli mathematician, analyst and former general," "head of the Security Studies program in Tel Aviv University and the chairman of the National Council for Research and Development" and he also "heads Israel’s Space Agency." Wow. Another mathematician, but one presumably dedicated to the safety and well-being of the nation he serves, and highly competent. And here he slams economic closures in Israel and elsewhere as disproportionate responses to a virus that apparently gets bored and stops bothering people in a certain country after a few weeks. Maybe he's hoping the idea catches on in Iran. He "claims simple statistical analysis demonstrates that the spread of COVID-19 peaks after about 40 days" (and thus, 40 nights) and then "declines to almost zero after 70 days - no matter where it strikes, and no matter what measures governments impose to try to thwart it." He completely fails to explain why this would happen, simply claiming that it does, according to the numbers, which don't lie.

But if 40 days to "play out" means after he first reported case, it's pretty well disproven as a general pattern, even checking against the nations he cites as examples (Sweden, Singapore, Taiwan). If he has another measuring point, it's unspecified and would probably prove wrong as well. Taiwan is the most fitting to his description, with no others close to conforming. And in Taiwan as everywhere, it's impossible to separate natural progression from human-imposed limits.
https://libyancivilwar.blogspot.com/2020/04/covid19-experts-and-fake-curve.html

As it happens, in the UK 40 days in is March 13. That's a rough and variable number (about 40 days - unless he meant divinely-ordained 40-days/40-night, which I guess would be exact). So this could be seen as fitting the other indicators pointing to a mid-March peak. To Ben-Israel, that would have nothing to do with the distancing and hygiene measures taken then, as Heneghan suggested. He'd say it's just how this virus works, with some never-before seen self-destruct mechanism that kicks in just early enough to make counter-measures seem unneeded. How that maps out against actual data is included in the big UK graphic at top, in the blue-gray boxes.

3) More from Andrew Mather or Math(hoax)er. I spent too long in my last post re-explaining the logarithmic optical illusion he passed off as showing some real declines in every nation's infection rates - the artificially flattened curve he gets with this trick looks similar to China's aggressively contained spread, so he slapped them together misleadingly to suggest a natural mellowing akin to what Ben-Israel imagines, and at least in the UK, coming out on a similar timescale.

His latest video includes a few more confusing graphics ...
https://www.youtube.com/watch?v=QjyhGboI4C0
https://peerlessreads.s3.us-east-2.amazonaws.com/CV19FNF_NoMoreLiesItsOver_200425a.pdf

At 3:15 he shows "ONS registered deaths, COVID19 involved" labeled "Daily Growth" but also, on other slides, it's "rate of decline for new-daily deaths" or "the death and case new-growth rates" which "just keep going down, as they have done since day one." (meaning since this peak of something on March 14 or 16, not since first confirmed cases on Feb. 2). I admit I'm a little hazy just what these and other figures are supposed to show, but here are two cropped slides from the PDF version that I decided to try and explain. In both cases, the jagged blue line shows the falling UK number(s), and come with reminders that the peak deaths and cases has passed, suggesting the graphs show the decline from that point.
The smooth curves above seem to trace the low vs. high trends of the blue curve later, the reddish ones marking the same earlier. He suggests the data changes later to avoid showing the natural decline he keeps pretending is real. As I'll show below, it's not clear what the blue line actually represents and how accurately it's plotted.

The smooth curves here just the high, middle, and low trends. The blue curve is different from the one above, but similar and, as I'll show below, is probably based on the same data.

Whatever this number is shown by the jagged blue lines, it visually seems to decline on balance, from a high at graph's start on 3-16 to the present, where it seems both much lower and more stable, likely to settle at zero any time now. But is a zero "decline for new-daily deaths" good, bad, or just dependent?

In this presentation, Mather says - as he has before - the same curves include numbers "breaking through 100% (peak deaths) on the 10th/11th April, in line with 11th Peak in Cases." But the visual shows an apparent high on March 16. That's on a scale given in percentages. Is it % compared to April 10/11 as 100%? No, because no other day should have more than 100% of the peak (highest day), or that other day would be the peak. But April 10 itself plots out at 15%, not 100 (and that 15% represents 980 deaths that day). Then March 16 plots about 165%, and that refers to just 34 new deaths. 34 clearly is not 165% of 980. This whole thing has some meaning other than the one visually suggested.

...
Main data source: https://bing.com/covid/local/unitedkingdom?form=COVD07
This seems to use the same WHO numbers everyone else does, although I've seen smaller tallies in some spots, etc. I used each day's increase AS a percent increase over the prior total for the orange plots on a scale ranging from 0 to 170% … working manually with my cell phone's calculator,  I might have a point or two wrong - anyone can check - the list below has all the numbers I used - possibly with wrong spots as well. In these two example entries, you get the orange plot by dividing the 10 on line 2 by the 11 on line 1, for a 91% increase.

date - new total - daily - %
3-14   11      +1       10%
3-15   21      +10     91%

This I overlaid with the blue curves from Mather's slides 1 and 2, lined up by dates and somewhat by value. As noted, his start point ~165% has the same basic number I found for that day (162%) and should line up as here. If the lows are also aligned, a middle peak on 3-28 also lines up. But between these points, all his numbers and lines come out different, seeming more "plausible" than my orange plots, Note these blue curves don't even match each other, but all three seem to share a general pattern dropping from about 160 to about 5% over the same time, just variously distorted. that says to me he's using this base method, along with some other math trick that mellows out the wild dips and rises of this irrelevant number, or maybe he's just drawing in "plausible" lines between the real highs and lows.
...

notes:
* At one point, Mather says the plotted data was "delayed 4 days to best reflect WHO data." The best pattern match-up comes from lining up the dates directly, with no 4-day shift.
* At another point, he says the peak % increase was on 15 March when 2 deaths jumped to 11. But on my end 11 was reached on the 14th after climbing to 3, 6, and 10. The jump is on the 16th, from 21 to 55, and that's the 162% he shows as the start point in slide 1.
...
date - new total - daily + - %
3-6  0
3-7  1  +1 inf.%
3-8  2  +1  100%
3-9  2  +0  0%
3-10  3  +1  33.3%
3-11  6  +3  100%
3-12  10  +4  66.7%
3-13  10  +0  0%
3-14  11  +1  10%
3-15  21  +10  91%
3-16  55  +34  162%
3-17  71  +16  29%
3-18  104  +33  46.5%
3-19  144  +40  38.5%
3-20  177  +33   23%
3-21  234  +57  32.2%
3-22  282  +48  20.5%
3-23  335  +53  18.8%
3-24  422  +87  26%
25  465  +43  10%
26  578  +113  24%
27  578  +0  0%
28  1,028  +450*  77.9%
29  1,228  +200  19.5%
30  1,408  +180  15%
31  1,789  +381  27%
4-1  2352  +563  31.5%
4-2  2921  +569  24.2%
4-3  3611  +690  23.6%
4-4  4313  +702  19.4%
4-5  4932  +619  14.4%
4-6  5373  +441  8.9%
4-7  6159  +786  14.6%
4-8 7,097  +938 15.3%
4-9  7,978  +881  12%
4-10  8,958  +980  12%
4-11  9,875  +917  10%
4-12  10,612  +737  7.5%
4-13  11,329  +717  6.8%
4-14  12,107  +778  6.9%
4-15  12,868  +761  6.3%
4-16  13,729  +861  6.7%
4-17  14,576  +847  6.2%
4-18  15,464  +888  6.1%
4-19 16,060  +596  3.9%
4-20  16,509  +449  2.8%
4-21  17,337  +828 5%
22  18,100  +763  4.4%
23  18,738  +768  4.2%
24  19,506  +768  4.1%
25  20,319  +813  4.2%
26 20,732  +413  2%
3-27  21,092  +360  1.7%
3-28  21,678  +586  2.8%
--- graph end
3-29  26,097  +4,419** 20.4%
3-30  26,771 +674 2.6%

* a clear 2-day tally following a blank day
** adds previously excluded deaths in care homes, etc. (outside NHS hospitals) + unclear daily tally
...

Sunday, April 26, 2020

Forensic Medicine vs, Lies in Syria

April 26, 2020
(rough, incomplete)
adds 4-30

The War Through the Eyes of Forensic Medicine (Part 1) is a fascinating documentary from Lebanese Al-Mayadeen's From the Ground program (which previously did an awesome show on the 2013 Latakia Massacres) This is filed by the same reporter, Ugarit Dandash, and was aired in March, now hosted by Arabi Souri and SyriaNews.

al-Mayadeen page
https://www.syrianews.cc/the-war-of-terror-on-syria-through-forensic-medicine-graphic/
https://www.bitchute.com/video/bnL6vYMzOR5W/

This seems to be a part 1, suggesting there is/will be a part 2, which might cover the "Caesar photos," in which case I'll be very interested.
4-30: Michael Kobs, who alerted me to this show's existence, had to point out part 2 was already up and linked. That's here, with content (not covering the Caesar photos) to be worked in below.
https://www.syrianews.cc/the-war-of-terror-on-syria-through-forensic-medicine-2-graphic/

Dr. Zaher Hajjo
In part 1, Dandash speaks mainly with two informed experts:
- Dr. Zaher Hajjo - head, general association of forensic medicine, Syria (right)
- Dr. Bassam Muhammad - head, general association of forensic medicine, Homs (below)
In part 2 ...
- At least one other, female doctor ...
- ...

Dr. Bassam Muhammad, Homs
Dr. Hajjo especially is clear in underlining how forensic medicine has blocked lies against the state, helped them learn of emerging dangers, from professional snipers with better weapons than the Syrian army, to helping decode the ominous signs emerging in the torture and mutilation of citizens. Dr. Muhammad shares some harrowing stories from the early days in Homs, 2011.

Marie Colvin
The famous case of the journalist Marie Colvin is highlighted here. Dr. Muhammad explains how her body was found "buried" in Baba Amro in early March, 2012. This is shown, with little or no soil on her clothes (so lightly buried, and not for very long - she was killed on Feb. 22, in the last days before the government defeated all militants and restored order there). The photographs were interesting to me, but maybe unnecessary for the general public. Hence, no need to re-show them here. But what they show is important. As I'll try and read it for you:

- a messed-up seeming right eye, left eye invisible - it was the left eye she always covered with a patch, so this is part of her fatal injuries.
- partial dentures (or what is it, a bridge? the bolted-in kind, but now loose)
- small pock-mark injuries as from "shrapnel" (primary explosive fragments), apparently coming mainly from her right side
- a severe excavating injury to the left shoulder, now blackened with decay (and/or burnt?)
- some kind of redness, abrasion, and maybe breakage of the upper right arm, possibly explosion-related
- a cracked upper skull with a large (entry?) wound on the upper right side.

X-ray slides are also shared, showing no collarbone on the left, and a skull crack all along the front, besides an apparent nail in her skull that's said to show a "home-made grenade" (or nail-bomb?) killed her, not a weapon of the Syrian military. Otherwise, just small fragments are evidenced on her skin and in her leg x-rays (shattered bone at the worst of it), with fewer marks at all to the face and head, and those perhaps being upward from a low angle. I see no other nail impacts suggested, except perhaps in a longer gash to the right forearm. Something sizeable and round lodged in her right shoulder? Anyway, it's for more expert people to say what this all means.
Marie Colvin x-ray images

I haven't studied the Colvin story that much, except to assess the legal case made based on the "Assad Files" and mainly on the claims of defector "Ulysses." By this, Syria was tipped off by "Lebanese sources" as to Colvin's crossing, and Assad issued an order to "do the necessary." He may have, but that's allegedly a code-phrase meaning arrest her but also to kill if necessary. So Colvin's location at a media center was pinpointed, the regime tried arresting her by shelling the area around the media center (presumably with some kind of mortars), then closer, then on it. Then once people were killed an maimed, they stopped, let the media activists bury Colvin, and evacuate Paul Conroy, etc. Assad had gotten himself in deep trouble murdering a high-profile foreign journalist, mission accomplished. Was that really "necessary"? Also, there was no reflection of this whatsoever found among the million pages of "Assad Files," even the plausible order to "do the necessary" which - in documents that do exist - seems to means arrest them, monitor them, nothing else specific.)

Jisr al-Shughour massacre
At about 20:00 in they discuss the June 5, 2011 Jisr al-Shughour massacre (ACLOS page), which the reporter, Ugarit Dandash was eager to get to. There, just across the Turkish border, an unnaturally strong force of a nascent "Free Syrian Army" ... allegedly did little as soldiers and/or Hezbollah guys massacred each other in a major controversy over shooting some unarmed protesters. The death toll remains a bit unclear and disputed, including civilians killed in a general rampage, besides soldiers, police, postal workers, and other civil servants. Dr. Hajjo adds previously unknown details including how one man was cut in half longitudinally (which would take something like a chainsaw if I visualize that right), and another was forensically proven to have been buried alive. 90 bodies were found by a team including Hajjo, as he says, and at least another 15 are believed killed but were never found.

Robert Ford blocking the stench on a "sanitized" visit to JaS
At 22:00 Hajjo says how hostile powers had their experts come and ty to discredit the Syrian narrative, picking out supposed discrepancies - but he says their medical explanations were so convincing no one could challenge it; a Gulf Arab news channel's reporter said the Syrian case seemed to be true, and was simply replaced with a more compliant reporter. I'd already seen a BBC report conclude the same. The story was described as "sanitized" by a state-arranged visit for media and others, including US "ambassador" Robert Ford, who was criticized for even attending. Yet the Syrian government has still never been held to account for their alleged massacre of their own troops. No one's in trouble at all. If you haven't already, ask why.

The perpetrator, as Damascus sees it, was Lt. Col. Hussein Harmoush, a Salafist-leaning defector who headed the local FSA. After the massacre, he wound up in Turkey, talking to their intel service MIT, who were apparently backing and tracking his actions. But his own MIT handler was so personally sickened by the crimes he was forced to keep track of, he defied Erdogan to kidnap Lt. Col. Harmoush and have him smuggled back into Syria to face justice, which he apparently did. And there's an unusually happy ending to a still-tragic tale.
https://libyancivilwar.blogspot.com/2015/10/hussein-harmoush-fsa-defector-profile.html

Note: the footage used at 20:17 of bodies dumped the river, is from Hama some 6 weeks later; Al-Qaeda-linked militants there had kidnapped and slaughtered at least a dozen "secret police" officers the night of July 31/August 1. That story that plays into this amazing article I wrote for 21st Century Wire that just destroys the fake "Assad Files" narrative of the "Committee for International Justice and Accountability."
https://21stcenturywire.com/2018/10/11/revolution-unraveled-assad-files-now-an-achilles-heel-for-war-crimes-narrative/

Hamza al-Khatib
At 25:40 both doctors speak to the pivotal story of the boy Hamza al-Khatib, said to be arrested from a peaceful march on April 29, 2011 and killed on May 25 after a month's torture. Both of them emphasize how the "bruises" on his body said to show beatings was actually decay, as I've also said (bruises ae blue then yellow-brown, while these spots are green-going-on-black). The activists lied; he was fatally shot on 29 April and spent the next month slowly decaying under refrigeration, not suffering torture in a jail cell. The gunshot wounds that killed Hamzah were called cigar burns in some accounts, because they turned black ... with unacknowledged decay). As I've noted, he also lacks the shackle marks he should have if hanged by his wrists for a week, as alleged.

Other issues:
- Age of about 16 proven by forensic medicine? He's always looked to me younger than that, was noted by initial examination to lack body hair that's usually there by 16, is said to be 13, and his ostensible grave marker has him as 13 when he died or still 12 if it was on April 29, as I believe. He did appear unusually tall for that age, besides heavyset - clearly older than shown in his famous school photo - and Dr. Hajjo says the boy was more like 16, based on dental and skeletal details. I'll leave it disputed (maybe tall and 15-16 skeletally, but 12-13 otherwise?) Note that still no one has said he was in his 20s except in a mistranslation of "second decade" (age 10-20) and repetitions of that.

- Shot while defending the housing compound at Saida? It seems this is what Dr. Muhammad says here. Otherwise Hamzah is said to be among the people who walked there from other towns. Some 50 other men and boys were also reportedly killed in a "Saida massacre" - some shot that day and others arrested and tortured to death later. One woman was listed as killed by "shooting" by the opposition VDC (whereas the marchers seem to be exclusively male). She and the captain of the guard also listed by VDC at least seem to have been killed from within the compound, presumably by the attackers. Was Hamza as well? I still don't think so. His family seemingly lived elsewhere, in Jeezah. In fact that might have just meant shot during the defense of the base, in line with prior, vague claim-guesses. But to me the three gunshots suggests a strange sort of close-up execution, not accidentally gunned-down at random; it appears he was shot through each arm and into each side of his chest (from the left and the right), probably while bound hands-behind (why else would his arms and sides both line up like that?), as well as in the middle of the chest from the front. The other victims we can see on video have sporadic signs of execution, including stab wounds and likely torture. They also tends to have patches of green like Hamza suggesting that violence all happened on April 29.
- Severed penis: this was the most extreme of the claims against the Syrian government, and always denied by their official examinations and statements. The visuals - let's just skip the details - were always ambiguous to me, allowing for that denied mutilation (while far from proving it). The circumstances also allowed for it; the terrorists hiding in that "protest march" may have brought him, shot him, and dumped him all to demonize the state. Adding such a horrible mutilation would only make sense. It might have been denied in 2011 to ease tensions/because no one outside Syria would buy it. But I don't see these doctors now avoiding the charge on either basis, considering all the other incendiary crimes they discuss freely. So I'll defer more than I have - apparently even the terrorists refused to make that mutilation real.
Background: http://libyancivilwar.blogspot.com/2016/04/re-considering-hamza-al-khatib-and.html

More Horrors
I'll cover other points more in brief (especially as I should cover part 2 here as well - unless it's super-interesting, which it might be.

Around 34:00 Dr. Muhammad relates a tragic story of a civilian kidnapped in Homs and tortured, including a bizarre surgical procedure to prevent him urinating. Three days after he disappeared, they set him loose in a car rigged to explode (on a signal? a timer? His rising from the seat?). As the story goes, he drove to security checkpoint, maybe on instructions or to seek help. As the story goes, on seeing the lone guard coming to greet him, he changed plans and backed the car up some ways before the bomb was detonated, killing only the tormented driver. Dr. Muhammad says this story was kept quiet at the time to avoid anyone copying the idea, but was reported to a UN-Arab League mission (the mission was initially sympathetic, but later re-staffed and made more hostile to Syria.)

At 40:00 Dr. Hajjo tells of a civilian accused of supporting the state who was kidnapped (region and time unclear) and then tortured so badly over a span of time that his wife paid the terrorists a hefty ransom just to have him killed so it could end.

Finally for me, at 37:15 Dr. Muhammad describes how the terrorists had (in Homs, 2011), carved all the flesh off one victim's face, head, and body from the chest up, most of which - if not all - should be done after he had died. I presume a forensic doctor knows this was done with blades, and extra-sick terrorists were at work in Homs; they did mutilate bodies and they might carve the flesh off people, and even eat it for all we know. The famous "FSA cannibal" Abu Sakkar (killed 2016) founded the Farouk brigades early on in Homs, and was perhaps active at the time of this episode, though he only became infamous in 2013 for a video-recorded bite into the (liver?) of a killed soldier. But FWIW that was a symbolic bite, a twist on mutilation - he didn't truly chew and eat any of it, that we see, and didn't spend much time carving out more than the one organ. And just to be a know-it-all, I'll suggest this - when I've seen skeletonized bodies or faces (where neither fire nor advanced decay is involved) - and they were left outdoors for any time - my first presumption is predation; feral dogs or wild animals ate their flesh as food. They have better motive for such a hassle of an operation. If his body was more covered or less appetizing from the chest down, that would fit the bill. But that should have been considered, and it's not what Dr. Muhammad concluded, so I defer, but only after mentioning the other option, just in case.

Saturday, April 25, 2020

More COVID19 Reality Checks

April 25, 2020

People are still debating if there's any serious danger from COVID19 to justify the widespread "lockdown" anti-mobility measures taken by a majority of the world's governments. They see a death toll not so high, imagine that's got nothing to do with the lower levels of human contact (direct and indirect). That's exactly how diseases have spread in the past, but they think this one is different - it either doesn't spread much, or spreads just as well through walls as it does through close air or skin contact.

At least, these are the sort of implications underlying the conclusions of morons pushing to end the tyranny of lockdown. Here I'll share again some infographics I've been working on - possibly final updates to make my case so I can move on to other things. They're all a bit big to read on-page, sorry. But they can be popped-out in a new tab, etc.

United Kingdom
Coronavirus lockdown opponents in the UK especially are inspired by some arbitrary and heavy-handed enforcement of distancing rules, and at least one alarmist prediction of half a million dead which they found laughably off. This has left them plenty of choice, but still they formed and firmly hold a mistaken idea the virus presents no real danger; it's a myth invented to facilitate their enslavement. They've been zealous in defense of the economy, privacy, liberty, and the mental health of cooped-up people, calling the cure worse than the disease, which they say is comparable to any annual flu.

As they all-but predict the end Western Civilization (maybe Eastern + middle too?), they've been less interested in the details of the danger that's mobilized their government and nearly every other on Earth to impose these unprecedented measures. Several of these sudden armchair experts have been quite certain the virus would get unusually "exhausted" in its tangle with the Brits, the death toll would be minor, the peak had already passed, etc. Over here, I thoroughly illustrate how a favorite claim that WHO data supports those view is based on an optical illusion and a lot of deceptive branding. Others have reached similar conclusions based mainly on wanting there to be no danger. They seem not to notice they're proven more wrong every day that the UK lodges another couple thousand cases and loses on average 800 lives, as I gather just in NHS hospitals (or perhaps that refers to the even-lower tallies I see in some places - admittedly hazy on that). A sizeable number also die in prisons, at home, in care homes, and wherever else. The official death toll now stands at just over 20,000, but (if it is so exclusive) the real toll might be 50% above that or even higher. Just the 20k puts the UK at the moment at #5 worst rate of deaths per population (behind Belgium, Spain, Italy, and France. They come out just ahead of the Netherlands, then Sweden - the other two initially joining the UK in a "herd immunity" approach)

Sweden
The lockdown critics often cite shining examples of less intrusive methods, first and foremost being Sweden. Their strategy based on "herd immunity," a policy initially taken but quickly abandoned by the UK and Netherlands. But this is not as uncontrolled as some think, and seems to be less effective than those same people think. A range of anti-mobility options were suggested and largely employed by a fairly astute populace, keeping the spread under control with a sort of voluntary, partial lockdown that may not work so well in other countries. Even in Sweden, it's allowed 18,177 confirmed cases so far, and 2,192 deaths, so Sweden ranks 7th worst in the world for deaths - doing just better than the Netherlands and UK (#6 and #5).

Belarus
Some have pointed to the former Soviet Republic of Belarus as an even better example of non-interference, where the government suggests normal routine, vodka, and visits to the sauna (besides quiet containment measures) would suffice. A slow start in a less-populous county let that seem feasible in Belarus, but they're currently just above 10,000 confirmed cases, likely with low confirmation so true rates are more like 20,000 or higher. In a populace of just 9.45 million, that's at least 0.11% or infected, and it's rising fast - what was 600 confirmed cases/day is more like 800 in recent days.  President Lukashenko has publicly named and rejected the same kind of NWO conspiracy theories held by so many lockdown opponents. These love to suggest people don't die from COVID19, but from other things - in large numbers, shortly after contracting it. They might embrace President Lukashenko's Stalinist decree that in Belarus, no one will die from COVID19, but instead from those other things. So far 72 deaths are reported by WHO as linked to the illness, but he would dispute that. It's hard to say how many patriots have died quietly at home, with vodka in hand but nothing confirmed. I also noted a delay in reportage for 2 days, shortly after that announcement - Belarus may have stopped reporting to/cooperating with the WHO, but if so they got back on, but still may avoid learning and reporting the true number of cases and deaths.

Brazil
Less people cite the example of Jair Bolsonaro, the "Trump of the Tropics" as he leads the 210 million people of Brazil though this "little flu" that might get worse come flu season there. He too senses a conspiracy and rejects it, trying to override local lockdown orders, even firing his health minister - managed to get TWO false-negative tests to confuse a first and fourth test showing he DID have the virus and should have avoided spreading it around Brazil, in Miami, etc. As Bolsonaro understands Brazil's economy, it's like that Fukushima reactor: it "can't stop." They're digging mass graves now.


Turkey
Turkey ... on average perhaps similar to Sweden, but with more heavy-handedness that's sporadic and based on an even more muddled relationship with real-world science. All-in-all control measures here are moderate in scale and effectiveness, but that's little help with Turkey's dense and mobile population. By 7 April they had the world's fastest climb of new cases - more than 3,000 per day. By later April they has racked up more than China or Iran despite the head start both had. Now at 108,000 they have more cases than any nation outside Europe and the US. As for "we're all in this together" - Erdogan finally gave up his plans to forcibly inject "millions" of partly-infected refugees into Europe via Greece. But then Tukey is also accused of stealing ventilators headed for hard-hit Spain. They deny that, and checking into it now (Reddit) ... seems a deal was made with a Turkish company that makes the machines, payment was made, but it ignored a standing export ban which authorities enforced, blocking the transfer. Then under pressure, they agreed to send the machines rather than return the money, as if to say "we're all in this together and we don't want any more PR that's that bad." Okay, that also makes sense.

Top Ten Worts Death Tolls Considered
from https://www.statista.com/statistics/1104709/coronavirus-deaths-worldwide-per-million-inhabitants/

Belgium: I haven't looked into this much, but heard they had an early care homes epidemic that skewed death toll unusually high. They should also have a bad general spread that would be wosre if not for the control measures they've taken.

Spain: not sure how it got so bad there and why - they're in "lockdown" - it's bad - cause-and-effect?

Italy: more so than Spain or anywhere but China, it hit Italy by surprise, before anyone could take measures, and has been hard to rein in after that. The initial phase would be extra-deadly, leaving a high toll others would only catch up to later (as happened - see above entries, and the ones below are still getting there)

France: not sure in general, but the last thing allowed before they started lockdown was the biggest ever gathering of Smurfs - some 3,500 people gathered in Landerneau, France had their skin smeared in blue paint (that everyone shared, probably) and posed together in giant white hats. Note these aren't social-distancing boxes used in some street markets now, but to cram a certain number into for easier tallying. In a pool that size, plus workers + others, it's possible there were no COVID19 infections and no spread, but otherwise ... they giggled at early coronavirus worries - Smurfs are immune! (should be a lot of Belgians there too, maybe taking it home, kick-starting things there?)

United Kingdom: initial response was "herd immunity" - let it spread, because it's hard to contain. The rapid spread and number of hospital cases piled up quickly and they changed course, found it hard to rein in. Even under lockdown it spreads in a slowed, incomplete herd-immunity, at a speed that's difficult but manageable.

Netherlands: same basic story as UK - herd immunity policy swiftly abandoned, but the early start gave the virus a wider spread that's harder to slow. And however exactly it happens, they get a high death toll proportionally almost the same as the UK's.

Sweden: same as UK, NL but for keeping the faith with herd immunity, probably because it kept seeming manageable - lower initial cases and slower spread, because the people went into half-lockdown mode with less compulsion required (a smart herd - probably smarter than most). Being low to start with, lockdown-type measures are on the increase now in Sweden as they try to slow the spread - others who already did are now looking at decreasing measures. Sweden has put itself 'behind the curve' in that sense.

Switzerland, Ireland, not sure.

US: sizable country, not the brightest, didn't take it seriously, and we have New York. Other details, but that's good enough for me.

Entities the IIT "reached out to"

April 25, 2020
incomplete

2. The IIT itself interviewed 20 persons of interest, including alleged victims, during this
phase of its work. Since the incidents under investigation took place in the same
geographical area and within seven days of each other, most of the persons of interest
were able to provide information for more than one incident.
(including the one that was clearly invented retroactively - not just unverified civilian witnesses, militant ones, possible militants speaking as White Helmets (day job), but also to … the White Helmets as a group, a bunch of Syrian opposition groups who collate the same kind of allegations, and various European agencies and NGOs that collate those collations and are taken as lending credence in the process (not that it was needed...)

These interviews were considered in conjunction with statements previously provided to the FFM and other entities. In relation to other entities that were willing to provide information, or
provide leads for the investigation, the general approach of the IIT has been to request
access to information that the IIT considered could be obtained from those entities,
and to assess it together with the rest of the information already at the IIT’s disposal.
In its investigation, the IIT reached out, among others, to the following entities:124

list:
1 The Center for Advanced Defense Studies (C4ADS);
2 Chemical Violations Documentation Center of Syria (CVDCS);
3 Commission for International Justice and Accountability (CIJA);
4 Europol Analysis Project on Core International Crimes (AP CIC);
5 European Union Satellite Centre;
6 Global Public Policy Institute (GPPi) – Peace and Security;
7 Human Rights Watch;
8 Independent International Commission of Inquiry on the Syrian Arab Republic;
9 Open Society Justice Initiative;
10 Peace SOS;
11 Syria Civil Defence (SCD);
12 Syria Justice and Accountability Centre;
13 Syrian Archive;
14 Syrian Network for Human Rights (SNHR);
15 Syrian NGO Alliance,
16 World Meteorological Organization (WMO) - relevant if the meteorological data was manipulated

Not: SOHR, any Syrian non-opposition groups like ... ones that have existed, still might, but I'd have to check.

1 The Center for Advanced Defense Studies (C4ADS);
- ?

2 Chemical Violations Documentation Center of Syria (CVDCS);
- interesting history, etc.
-- ...

3 Commission for International Justice and Accountability (CIJA);
- Assad Files: hoax
-- https://21stcenturywire.com/2018/10/11/revolution-unraveled-assad-files-now-an-achilles-heel-for-war-crimes-narrative/
- http://libyancivilwar.blogspot.com/2016/04/regarding-those-assad-files.html
- star witness who helped fill in the gaps
-- https://libyancivilwar.blogspot.com/2020/03/some-different-opinions-on-retun-of.html

4 Europol Analysis Project on Core International Crimes (AP CIC);
- sounds sure to be unbiassed (sarcasm)

5 European Union Satellite Centre;
- relevant if the meteorological data was manipulated

6 Global Public Policy Institute (GPPi) – Peace and Security;
- compiled the most inflated, dishonest collation of CW allegations against Syria to date
-- https://libyancivilwar.blogspot.com/2019/02/a-change-of-thinking-on-douma-chemical.html

7 Human Rights Watch;
- identified KhAB-250 by looking at it inside out, other incompetence
-- https://libyancivilwar.blogspot.com/2020/02/on-opcw-bellingcat-collaboration.html

8 Independent International Commission of Inquiry on the Syrian Arab Republic;
- uniquely Syrian CW weapon, etc. Bellingcat collaboration?
-- https://libyancivilwar.blogspot.com/2020/02/on-opcw-bellingcat-collaboration.html
- e.g. reliance on bogus OPCW findings like 'no wind theory' and location fudging to make their spread seem to work
-- https://libyancivilwar.blogspot.com/2017/07/idlib-chemical-massacre-4-4-17-wind.html

9 Open Society Justice Initiative;
- no research of my own - what can a Soros-run compiler of allegations really add?

10 Peace SOS;
- sounds cuddly - don't know them

11 Syria Civil Defence (SCD);
- would surely be in on any staged scenario, which they considered, and found against, based on things and stories "SCD" handed them

12 Syria Justice and Accountability Centre;
- https://libyancivilwar.blogspot.com/2019/08/a-clearer-view-on-assad-files.html

13 Syrian Archive;
- just video archiving? some commentary attached, maybe more?

14 Syrian Network for Human Rights (SNHR);
- long record, no overview of my own, several good articles by others
-- ...

15 Syrian NGO Alliance,
- ?

16 World Meteorological Organization (WMO) - relevant if the meteorological data was manipulated

Thursday, April 16, 2020

COVID19 "Experts" and Fake Curve-Flattening

Adam Larson (aka Caustic Logic)
April 16-17, 2020
rough, incomplete
adds April 20, 21, 23

Note 4-21: Apologies for this post's rambling sloppiness - I think I should leave this as-is and perhaps re-write the points more clearly somewhere else. It won't be at 21st Century Wire, that's for sure. Ideally, maybe someone with more reach than I who gets these points - especially Mather's graphing trick/error - could raise them anew to help fight this contagious idiocy.
---
So I've been making some enemies jumping into the COVID19 subject and controversies. A depressing number of otherwise intelligent, skeptical people now suffer from an excess of skepticism, and it's a moderate public health danger. I've argued the points so many times already, here short form: question are fine, but ask honestly. The wisdom of the current lockdown reactions of nearly all world governments are validly debatable, but two important points:

1 it's not a global conspiracy where millions of nurses, doctors, patients and fatalities are faked or exaggerated by compiling other deaths, etc. From Communist China to Theocratic Iran, hyper-capitalist US and UK and virtually every government on Earth - everyone who would agree too much death at once and a crashed medical system is no good, but neither is a wrecked economy - all consulted all their best experts on health, science, and the economy and decided on what they did. Maybe all of them are wrong, but …

2 … this suggests the danger is real, and the measures these armchair experts call terrible mistakes or an evil plot have a reasonable basis anyway. The rules should be followed absent some rather good reasons, as long as they're reasonable and not abusive (and you might not be able to easily tell which ones are and aren't).

Critics tend to focus on the actions of the home government they distrust, and taking that in isolation, find it easy to see it as the start of a horrible dystopic future, for which they had their elite "experts" fake a simple flu up into a compelling panic. They try not to lose a step over every other regime with all their varied interests doing the same thing at the same time - the Iranian scientists and the Russians etc. are also controlled, somehow. And all their doctors and fake patients involved in staging the "crisis" there … all their news media, etc. Everyone's in on it - they guess.

These independent minds aren't swayed by "science-ism" and official "experts" - but to back up their hunches, they cite other "experts" - some 20 of them or more known to oppose the status quo, who explain things like how COVID19 doesn't seem to kill anyone - people just drop dead from other things after allegedly getting it. That's reportedly been happening with thousands a day worldwide, close to 1,000/day just in the UK, but maybe the numbers are faked, or whatever.

And they say it's not that many; spotting early on how the low numbers (existing then) looked like normal tallies for a whole flu season, some predicted that would be the end of it, and it'd be like a normal flu season - which I hear kills thousands a day frequently, so hospital SHOULDN'T be extra-swamped. They don't seem to believe the reports that hospitals have been and are overwhelmed in many areas, and the fear is how much worse it could get seems ill-founded, to these skeptical minds. And of course not that many would die (not) from the virus - most are old, ill, were about to die anyway in the following weeks to decades. And they warn therefore POLICE STATE RESIST, etc.

Anyway, I've found this annoying and worth combatting, so I'm a "gate-keeper" and all that. Fine. Here I'll share a look at two expert (mathematician) views involving predictions that popped out for being cited at me recently. I close the gate on them (as if they'll actually be stopped by MY gate), and here's why.

First, on sources: I'm using what seems to be the standard running tallies provided by the WHO that everyone else uses, as tracked by Bing - https://www.bing.com/covid This has been called Bill Gates' fear machine and not trustworthy, but it seems to use the same numbers everyone else does, and it's handy. There is an odd issue I've noted where most graphs (but not all) are missing the date April 1, showing instead a sharp spike between May 31 and April 2. This error is variously ignored, crudely repaired, or not present in the graphs I use here. It doesn't seem to affect anything past that spot on each graph, but it raises some question... (the example here is from Brazil's graph) And of course there numbers aren't complete or gospel, include false positives, exclude false negatives and, unconfirmed cases, etc.  To some minds they also include lies or exaggerations, and I admit I can't rule that out. So, grains of salt and all that, we proceed.

Mather/Peerless Reads: Fake Not Facts
On April 5 I was informed by an exasperated Patrick Henningsen (21st Century Wire): "growth stage is over, growth rate hump and curling over now, so 'crisis' is over." Therefore, no justification for the ongoing repression of the people of the UK, contrary to what I kept arguing. He cited this video: https://www.youtube.com/watch?v=VBUHmwHN96U
"Coronavirus Fact Not Fear - Chart Update 1st April 2020" by "Peerless Reads" - which I see is run by "Andrew Mather, a 60 year old British mathematician, financier, author, techie."

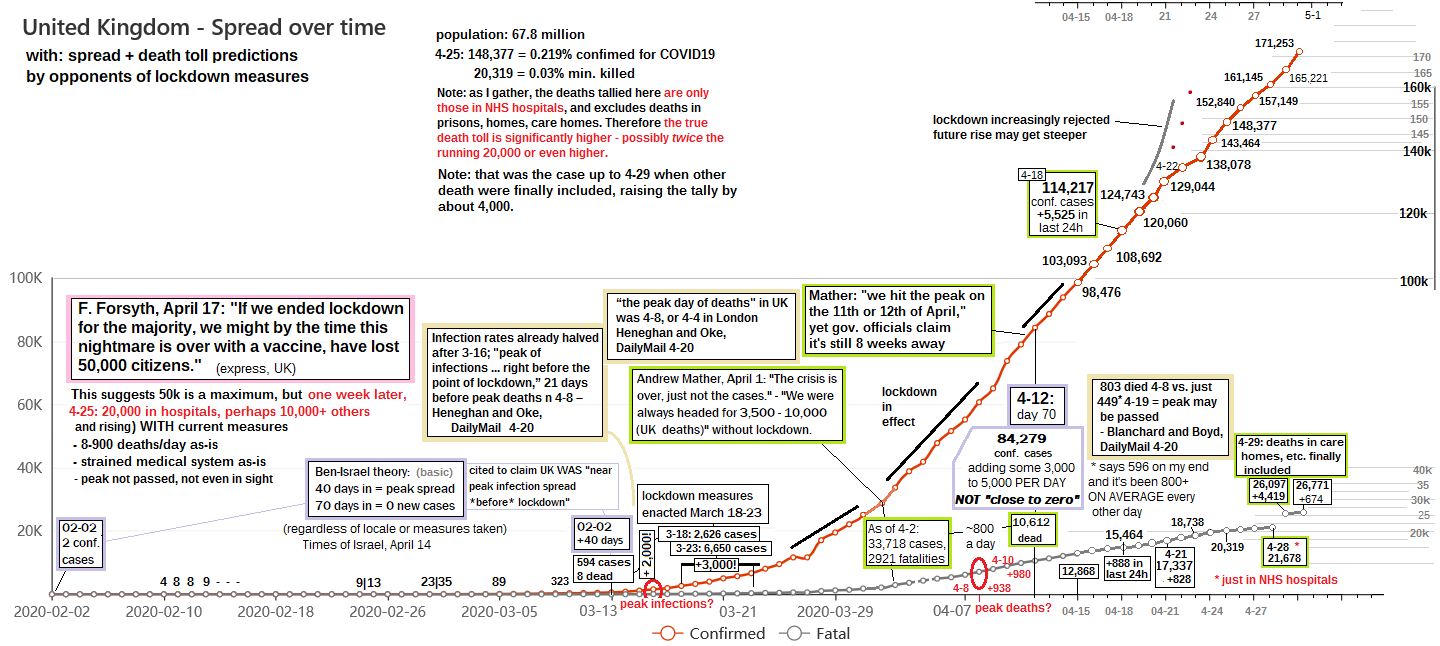
I don't think I understand "curling," but mostly followed what Mather says. The UK government's prediction of 500,000+ death there, shifted to 5,7000 if people comply with the Orwellian lockdown - that was all baldfaced scare tactics, he concludes after a calm look at the facts. Comparing reported trends between "Hubei (finished), Italy, Germany, Norway, and UK charts without lockdown," he finds all of them will level off, or already have, at a certain rational point where the virus wears out, gets bored, stops being contagious, or manages to have all active copies die or fall completely through the cracks between people that would naturally emerge.

Mather's projected final deaths in UK:
* 4,508 if it spread and killed naturally as it did in Hubei, China
* 6,064 if it killed as it had so far in Italy
* 10,269 if it killed as projected by some in Italy.
And after killing that many, the virus would get bored or whatever and go back to being mundane. That's the natural progression, Mather somehow decided. Therefore, "we were always headed for 3,500 - 10,000 (deaths), nothing like the 530,000 we were told to be scared of."

Well it's been two weeks. We can't check what WOULD have happened, so far, with no lockdown, except to say it'd be worse than what we see. First, a scaled-down example in Washington State (where I live) with my own inexpert guess at a reasonable spread without gov. Inslee's orders. Whatever the scale, that's the idea - distancing and lockdown seem to be helpful at keeping the levels lower.

Current UK deaths: 12,868 13,729 as of the 16th, and rising some 600-800/day (most days - it's ranged from ~400 up to nearly 1,400 in a day). Apparently, the UK never was headed for 3,500 to 10,000 deaths in total (nor to 5,700). Luckily, preventive measures have kept it from exceeding those predictions by a ridiculous margin - yet.

Here's the graph shown - dotted lines start at prediction time, April 1, and note that's where they start leveling - in his imagination. The curves before should be based on real numbers, presumably graphed right, but … they seem to have dramatically varying shapes compared the ones I'm seeing - they turn hard left, then hard right in a way that makes me wonder. We'll come back to that.

As for the comparisons, which of these nations did and did not use lockdown is worth more review. China - Hubei included - enacted strict lockdown and other containment measures. People were chased inside by drones, dragged off to quarantine centers in vans, etc. This is NOT the natural progression to compare to; this is actually more like the model of a lockdown response we'll only want to emulate in part.
This is quite similar to what Mather takes as the natural progression. But he might have noticed the boot imprint on the Chinese lines (gold, gray, gray in his graph) as something he shouldn't presume with the others - those would show the actual natural flattening he imagines, not the Communists' barely-truncated version, with that barely-needed boot. Also note there's been a recent spike of cases not shown here, linked to Chinese workers returning from Russia - another thing Mather doesn't seem to predict as natural. I mean, does the virus get bored of being bored after a while? (and add 4-17: China just reported they had under-reported deaths in Hubei hugely - add some 1,290 further deaths, a 38% increase of what's shown here, and what Mather used as a baseline.)

The numbers of cases Mather predicted wind up not too far off from what we see, but these follow on lockdown measures, and might well reflect them, even enormously. His assertion the same would have happened naturally is what hasn't been proven. And as I'll show, he underestimated its lethality, so a similar number of cases in the UK led to a higher death rate already in excess of his highest final prediction (in fact nearly 50% over his high end), and still it's still rising quickly.

But even if the numbers aren't so wrong, it's the visual graph most people will walk away with. That has colors and shapes and tells a story you can see. And it's confusing or even deceptive, and also makes it hard to make out what the predicted numbers are. Do notice those rises can't be read the normal way, but more like a Richter scale in reverse. I don't know if he did this to be tricky, but each rise is exponential, at least according to the numbers on the left edge: the top bar represents a spread of 900,000 (100,000 to 1 million), while the one below spans just 9,000, the one below that 900, then 90, 9. The bottom line shows a rise from 1 case to 10 cases. The top line looking all flat there should actually rise 100,000 TIMES as high as it does to be proportional to the bottom line. Obviously that calls for a different scale that does NOT create a false appearance of sudden onset followed by inevitable and swift flattening. This is what we want to happen for real, not in an optical illusion on the computer screen.

I tried a rough re-proportioning just from the screengrab. It's not easily do-able, but just for a basic idea what it should look like, see below - the top line is way taller than the one below and so on. But the difference evolves over the box, so it just keeps getting flatter as you go up and hence - the virus is getting bored (hence, my proportional numbers on the right aren't right). From there down I squeezed lines down, but fudged that too, to keep things even visible.

Adding: I watched the rest of the video - it compares other nations on the same exponential scale, showing the same "flattening" once the numbers get high enough to get more compressed. "Curlover" is the "curvature" or "flattening" that he says "says the growth is slowing down." But the flattening we SEE mainly means the growth is being shown more squished. I tried again to reproportion the thing better, with each line at least partly reflecting its own vertical distortion. I just skipped the bottom two rows, and again fudged the two above that. Far from exact but closer, I decided all lines stop about 1/4 of the way up from 100k to 1m, so below the marked 325,000 line. By this, his projections come out something like:
- Italy: 295k
- UK 220k
- Norway 170k

Again, the numbers there are per 100 million (so divide by 100 for the more common per million). By Mather's prediction, vs. as of today (April 16) per https://www.google.com/covid19-map/:
* UK (pink/magenta) should be at about 1,700/million and still rising, set to level around 2,2000/m over the next two weeks. vs. current cases 1,552/million - not that much off, but rising faster than predicted, even with current measures, while this was a prediction for without them.
* Italy (green): fully leveled at about 2,950/million predicted vs. 2,741.46/million current - it progressed slower than predicted, but still is not leveled off. Is something slowing it down? But yet it's not leveling off completely, on its own or with the help? What gives?
* Norway (blue): fully leveled at ~1,700 vs. 1,276 and still rising, just slower than predicted. Same questions as with Italy.
* Germany (red): no projection shown vs. 1,630.19

So he's not so far off from current numbers, but denies these are low due to lockdown measures - AND he decided they'd be final numbers in a closing story, rather than early points in a crisis that's still unfolding dramatically. Here's how this illusion-based claim (green boxes) - and the next "expert" claim (blue) - compares to actual running trends in the UK:

(add 4-17: record deaths in the UK just now: +1,708 deaths in a 24-hour span (now 14,576), +10,216 news cases. Also US deaths hit a record: +6,801 in 24 hours.)
(add 4-20: now past 120,000 confirmed cases and 16,000 fatalities - adding a lot of notes and Forsyth prediction)

The 40 and 70-day markers there take us to the other expert view I looked into...

An Israeli 40-Day-40-Night Theory
https://www.timesofisrael.com/top-israeli-prof-claims-simple-stats-show-virus-plays-itself-out-after-70-days/
Times of Israel reported on 14 April the findings of Isaac Ben-Israel, who is: "a prominent Israeli mathematician, analyst and former general," "head of the Security Studies program in Tel Aviv University and the chairman of the National Council for Research and Development" and "who also heads Israel’s Space Agency." Wow. Another mathematician, but one presumably dedicated to the safety and well-being if the nation he serves, and highly competent. And here he slams economic closures as disproportionate responses to a virus that apparently gets bored and stops bothering people in a certain country after a few weeks. Maybe he's hoping the idea catches on in Iran.

He "claims simple statistical analysis demonstrates that the spread of COVID-19 peaks after about 40 days" (and thus, 40 nights) and then "declines to almost zero after 70 days — no matter where it strikes, and no matter what measures governments impose to try to thwart it."

As the article notes, Ben-Israel "is not a medical expert," and cannot explain why his findings should be true; "Asked to explain the phenomenon, Ben-Israel, who also heads Israel’s Space Agency, later said: “I have no explanation. There are all kinds of speculations. Maybe it’s related to climate ("no matter where it strikes"?), or the virus has a life-span of its own (all active copies die on some cue?)”  A "leading doctor dismisses his claims" - and that's Gabi Barbash, a hospital director and the former Health Ministry director general, and that's besides all those more relevant experts consulted by the Israeli government, the Iranian and Chinese ones, virtually all governments that exist, on balance firmly disagreeing with his premise. I'm not buying it either.

"... research he conducted with a fellow professor, analyzing the growth and decline of new cases in countries around the world, showed repeatedly that “there’s a set pattern” and “the numbers speak for themselves.” He "claims simple statistical analysis demonstrates that the spread of COVID-19 peaks after about 40 days" (and thus, 40 nights) and then "declines to almost zero after 70 days — no matter where it strikes, and no matter what measures governments impose to try to thwart it."

He was interviewed about this on Israel’s Channel 12 (Hebrew), where Prof. Gabi Barbash, a hospital director and the former Health Ministry director general, strongly disagreed, arguing that the death toll would have been far higher if world governments had not taken the preventive measures Ben-Israel was griping about. That mammoth blind spot seems to have also skewed Mr. Mather's outlook.

The article cites "countries, such as Singapore, Taiwan, and Sweden, which did not take such radical measures to shutter their economies" as those where the mathematician saw the pattern clearest. That lets us narrow-down some double-checking.

Taiwan: The first case was announced on 21 January 2020. March 1 is 40 days in – Bing graph has a sudden start only on 3-17, at 77 cases, 1 death. By 3-31 it's at day 70 and should level off to zero, but it's risen to 322 cases, 5 fatalities. Maybe it slows down a bit late? We can check 15 days later – 4-15 it was 395 cases, 6 deaths, and rising but only very slowly - only 7 cases added in a day.

Taiwan and the PRC - the two version of China - are perhaps the best examples for a curve that flattens, whatever the cause. They both show roughly what he describes. But neither is a typical case, even among those few he cited.

Singapore offers another example similar to Taiwan - an island near China with some heads-up and aggressive early controls that kept the number of cases to manage quite small. Day 1 is Jan. 25, with 3 cases confirmed at once. 40 days in is 3-5, 305 cases and no deaths yet. It should be peaking and then leveling to zero by about day 70 days - that's 4-4: 1,189 cases, 6 deaths. If it's close to zero new cases/day by then, there should not be some 2,500 added in 11 days by 4-15, as there was.

Sweden: with its notably libertarian stance … 1st case 02-02. 40 days in is 3-13, when they had 620 cases, no deaths yet. It should be leveling, and another 30 days in it should be nearing zero new cases/day. 70 days is 4-12: 10,483 cases, 899 fatalities (up 332 from the day before - a bit slower than surrounding days). And it's still rising sharply at 70 days. 3 more days on, it's hit 11,927 cases, 1,203 deaths and still rising - now with day 74 still not fully tallied, there's 12,540 cases and growing fast, 1,333 fatalities and set to keep rising for a while.
Update 4-21 on tallies to April 20:
* Taiwan, day 87: 425 cases, 6 deaths: still mellow, without lockdown. They had good luck, but were prepared for bad luck too:  "Taiwan hasn’t needed lockdowns to fight the coronavirus, but it simulated one anyway" https://finance.yahoo.com/news/taiwan-hasn-t-needed-lockdowns-092940133.html
* Singapore, day 86: 8,014 cases, 11 deaths - "Singapore extends lockdown after sharp rise," etc.
* Sweden, day 78: 14,777 1,580 - "anger in Sweden as elderly pay the price for coronavirus strategy" - still the price is not as high as it could be - they have many controls in place, Swedes police themselves fairly well as to hygiene, distancing, etc., and they may have good luck there, like the deadlier strain(s) not arriving (yet).

Not mentioned by either of these experts: the record on other non-lockdown nations: Brazil, Turkey, Belarus. Have a look at these things I've been working on (40 + 70 day marks not added):

Brazil (4-17 update) is the only county considered here that's in the southern hemisphere, so NOT even in its flu season. It spreads badly anyway, but to let it get this bad in April is probably an epic failure by the "Trump of the Tropics."

Turkey (4-17 update): see here for a post I did on the Greek border issue (blue boxes above)


Belarus (4-20 update) was faced with the same temptation as every state: keep things normal and hope this passes with minimal damage. They also have a low population, less global travel, less early cases, decent management of the few they cases they knew of, and hardly any problem until recently. Even now at 42 deaths total, it might seem laughable to think it'll ever get out of hand. But then see where all these other countries got to once the numbers start rising that fast, and recall this is another nation of millions. They will have at least 3x this many cases, maybe 10x. The deaths will follow, and they'll go deep onto the hundreds, likely low thousands, depending how good their medical system is (not sure, but might be good - former Soviet republic, etc.)
Add 4-20: they may be not reporting new cases? Something wrong with the tallies not changing ...

Above, the UK chart shows 40 and 70 day markers that absolutely do not correspond to leveling of rates, even if we shift day 1 to some later point. New York state was mentioned; Prof. Barbash cited it as showing Ben-Israel wrong, but the latter  "noted the latest indications from New York were precisely in line with his statistics that indicate daily new cases figures peaking and starting to fall after about 40 days." Checking that: 1st case 3-01. 40 days to 3-31 = a rise of 180,457 cases, and 8,627 deaths. And then it's slowing and starting to level? A bit early to say for sure, but ... no. 3 days later (April 14) Ben-Israel says he's seen a decline, but it's not there, and 4 days later the state has 213,779 cases, 14,030 dead, and still climbing petty sharply. The last 24 hours alone saw +18,847 in active cases, +1,473 deaths (a 24-hours span jut hours ago had included 3,196 deaths). So day 70 is still  up in the air. With any luck and enough people taking it seriously, it may be close to zero growth by then. God knows they'll need it by then, but they probably won't get it - it'll probably just be hitting that "40-day" peak, and the "70-day" wrap-up will take another 100-150 days. And hopefully by then there will be a vaccine and better treatments, making the remainder of the lockdown program unnecessary (or less useful, anyway).

Back to Mather - and wait, why is a mathematician name "Mather" - pure luck? He had UK infections set to level around 2,630/million, Italy at 4,000/m, Norway at 1,400. This was his varying natural point where the virus would get bored. Well it's not done yet in New York and it's at (New York State: pop ~20 million vs. 222,284 cases = ) 11,114/million, nearly three times the highest rate he predicted, for Italy. And looking at the curve, you can see that's not even close to the final answer either. And this is WITH CURRENT MEASURES, weeks of lockdown adding up so it's not 2, 3, 5 times worse than this - as it would likely be by now if we sat around waiting for the virus to get bored, or sat around waiting for the predictions of these "experts" to come true. (And an upside to the quick growth of infections is these guys get proved wrong quickly - they could be confusing people for longer, and causing more damage than they are.) So to summarize … shit's serious, and those guys are wrong, expert or not. Take that into due consideration as you weigh policies against the risks. Questions do need asked in this time of unprecedented upheaval, but they need to be asked rationally and honestly.

Follow-up: comment left at Mathers' video, in case he doesn't allow it: Could have checked the typos, but EH.

If I might ask, why do your curves play out on a chart where each lines jump ten-fold in value from the line below? Se see a rise from 1 to 10 mapped the same vertically as a rise from 100,000 to 1,000,000. It's not clarified that this APPARENT flattening the higher it gets is separate from the real flattening you suggest is shown. I aske because they seem to be the same thing to me (the illusion=your reality, and since higher levels appear flatter and flatter, the illusion is somewhat OPPOSITE of reality) and because your predictions are being proven woefully wrong 2 weeks in. 14,576 UK deaths SO FAR and rising fast (+1,708/last 24h), and that's WITH lockdown, while you predicted 3,500-10,000 TOTAL, WITHOUT it. Maybe I'm just confused, so you can allow the question to stay public and then provide the answer. Sub-question: does each line have its own steady value, or as it seems, does the curve play out evenly across the chart?
I expect it'll take him forever to admit that he saw the comment - or he'll delete it, possibly. I also did another graphic in more detail: here I get his magenta line and the actual plots to match at the stat and at April 1, and extend the red over (and up!) from there, at the same ratio. You can see how the actual numbers wind up looking different in the first part, and after 4-1 you can see the same distortion increasing across his projected rise. Also (it can be confusing) I split each row into its own internal scale, divided in 10 chunks of 9, 90, 900, etc. and mapped actual by-day numbers, connected into that orange line. You can see how each level show a natural section of the curve, but curving differently after bending at each sudden ten-fold decease in verticality. And the gap between red and pink should mainly reflect the difference between the numbers used - actual cases (red) vs. cases per 100 million (magenta).
 

There are tiny numbers in there to show what it's passing and we can see how deceptive this is. If you take visual rise as the indicator of trouble, you'd see a drastic climb from 2 to 8 (cases per 100 million), or from 10 to 100, and then see a slightly mellower climb from 100 to 1,000 then 1,000 to 10,000 - each over a similar time to the drastic climbs - then an even mellower slide through a TENFOLD increase over a longer time, 10,000 to 100,000. After 100,000 it's barely worth charting it's so uselessly horizontal. Passing from 100,000 towards 1,000,000, that'll take quite a bit longer and look super-flat, despite being another tenfold increase in nothing like tenfold the time. You could roll a baby carriage up that slope with no effort, lay down on it and take a nap without rolling downhill at all. And you can wonder why all these hospitals are griping over a piddling 900,000 further cases.

Speaking to his viewers without waiting in another comment in this later video:
https://www.youtube.com/watch?v=Tugj3jmv5n0
So Mr. Mather created an optical illusion with his charts; they use an exponential scale to artificially flatten numbers more the higher they go. See the labels at left and note a dramatic climb from 1-10 (per 100m) occupies the same vertical space and similar time as a leisurely hike from 10,000 to 100,000. Passing 100k now, the climb to 1 million will be virtually flat, good job.
But that was not leisurely in the real world, because 9 is not the same as 90,000 or 900,000. He acts as if this illusion reflects something real, but it's not lining up. He predicted 3, 6, maybe 10,000 deaths total, even without lockdown. But even with it, it's near 16,000 UK deaths already and still rising about 800+/day, because the infection rate is NOT "curling over" except in his special magic system. But we don't live there. Alright? It's a hoax. Quit being dumb, people. http://libyancivilwar.blogspot.com/2020/04/covid19-experts-and-fake-curve.html

https://twitter.com/MichaKobs/status/1251340173608194049
Kobs: see logarithm plotting for Italy - that's the scale and the effect of it - I might have known that's what you call this trick. Linear: that's what people expect to see, apparently think they ARE seeing.
The later video has a PDF form of all the slides (I guess his others do too)
https://peerlessreads.s3.us-east-2.amazonaws.com/CV19FNF_UKIndepth_2004010d.pdf
Methodology explained there:
slide 10: "Here’s what I had to work with. Raw data from the WHO DSR painstakingly typed in. And for this, I typed in every day for a few key countries (Italy, Germany, Norway, UK, US and Canada) rather than data every three days as suffices normally for chart updates."
11: "Noting each country’s population in millions, I then scale up or down to cases (total) per 100m population" (still not clear why he converts the numbers to /100m - just to make it harder to follow? FWIW he uses 66m for UK, lower than the 67.8m figure I use for /m calcs)
12: "Subtracting the previous day’s total from the next day’s figure, I get the cases declared on that day."
(Then something about plotting the numbers, choosing the scale, what he intends it to show - no details given here) and finally:
13: "The end result is some rather jagged charts as you see below" (all sharing a tendency to easily plateau, especially the higher they get)
Skipping ahead, he frets over the UK curve still creeping up and down despite his distortions, mumbling about an end point he didn't like, and concludes in slide 21 "I ignored the end point for good reason: it’s an outlier, a data point that can’t be relied upon and which disrupts a perfectly sensible picture." Yeah, tomorrow's will do the same, etc.

Add 4-20:
Another try at visually explaining the lie:


UK Column, April 3: Mather hoaxes Mike Robinson and Patrick Henningsen
https://www.youtube.com/watch?v=5KmyHP5szGY

Letting them know:
https://twitter.com/CL4Syr/status/1251488775466659840
https://twitter.com/CL4Syr/status/1252212050102587392

https://www.youtube.com/watch?v=EEjgPLsSJgc
Another Mather video explains curves for dummies as if it's all you need to read his graphs - all curves shown ae labeled and graphed in "linear" mode, and he emphasizes how utterly simple this all is - nothing tricky to it at all! Just graph the data - a curve is a curve - and then his important graph is algorithmic, NOT linear, something he never did explain, leaving you to see it as a linear-literal curve reflecting real-world changes.

I'm convinced this mathematician (and Mensa member, I hear - a genius) did this all on purpose, not accidentally. He'll know an algorithmic generated curve when he sees it, having just (as he says) manually entered the much higher numbers. I left another comment at that video (in reply to one of his) calling him a sick person who should stop his joke now that 16k UK residents have died and it's rising.  He keeps replying to fawning praise comments with shy thanks, urges to keep spreading his message of "sanity" - I'm sure he's seen mine, but has no reply so far.

4-21: a more readable (still confusing) comparison graph - note the gap between lines with magenta higher than orange just reflects the different units (cases per 100mil, calculated from 66 million rounded off UK pop) vs. plain old cases (out of what I'd call 67.8 mil, and would put his converted points a hair lower). That's what I plot in orange - the original, unconverted WHO case numbers.  Gap aside, they should and do meet right at his scale cutoff lines (same base data), then vary between - his follows the overall distortion and mine maps that level's averaged scale with a traditional linear curve, on five scales, for five separate curves telling very different stories, as shown by the numbers if not the shapes.
These overall slope shapes could be called rope up the stairs (orange)  vs. snake up the stairs (because it has a spine, muscles - and if snake is leading … it's leading in the right way.)

Hoax Cancelled? New York's Numbers Break Mather's Scale
add 4-23: Mather had predicted low deaths in the US as well before the virus got bored. I'd have to dig for the number he gave, but at 48k already and growing steadily, it's sure to have surpassed that by far. New York State has led in cases and deaths from nearly the start, at time having more than the rest of the nation combined. He seems to have no clue how viruses spread - seeing the numbers grow exponentially in New Yok City, he finds it implausible and probably a sign of fakery.

April 22: "Coronavirus or Cuomovirus? Twilight Zone New York under Governor Cuomo"
https://www.youtube.com/watch?v=sDa5HEgYaPU
In this video he's just talking on a bench outdoors (rebel!) presaging the terrible, exhausting lie he was about to reveal about NY governor Mario Cuomo's "fantastical battle." A whole new class of lies emerged, painting the virus as 5-10 times worse than it had been anywhere else (according to his optical illusions, anyway). He says he "cannot afford to be wrong" so has been taking his time.

Next, "Coronavirus Cuomovirus Cuomo and New York Virus Fraud" (also April 22)
https://www.youtube.com/watch?v=OKDkS3coKJM
then not talking at all, just showing the horror. The text reads in part: "Two [sic] tired to discuss what I'm discovering and revealing" and at the end "I've pushed it as far as I can" According to this data, NY had something 30x worse than coronavirus "the Cuomovirus?" He finds a span where NY had more cases than the rest of the US combined especially unlikely. (note the new charts have a label the old ones didn't: "LOG SCALE" (logarithmic, like the numbers always said))

Another comparison shows how close are the total for NY state, NY city, and the rest of the US. It looks odd, but this is on the high end of the scale - those differences are larger than they appear. At the end it's about 750k for the whole country (current 4-18/19), with well under half - 325k - being in NY (a bit higher than I see - 264k even now). About half of those (~150-160k) are in NYC (I see 146k now). That's 19.5% of all confirmed US cases - they may have higher confirmation than usual, but still may have 2-10 times as many cases un-identified.

I find that level slightly surprising, but exponential virus growth works best in dense urban areas, so it's not that strange NY city should lead the world and, once it's done that, to lead by a wide margin. It was by far the worst place on Earth to avoid COVID19, but will be getting better, as other places get worse. And Mather might be alarmed to find governor Cuomo may have collaborators; Gov. Phil Murphy oversees New Jersey, which is 2nd worst-off in the Union, part of a 2-state hot-spot. At almost exactly 100,000 cases for 8.88 million = 1,126,126 (1.13%). New York state has an average of about 1.35% confirmed.
Finally (?) "CvFNF ChartUpdate 200423a - Cancelled" 23rd April: there will be no chart update.
https://www.youtube.com/watch?v=_rxGexSEns8
He was beyond exhausted and planning to stay that way. He already gave us everything we need to "break three governments" - as he puts it the British one, and one headed by Justin Truedeau, and one by Bill Gates. In a comment, I said:
I get exhausted every day, but some sleep fixes it. You … I was wondering how long you would keep up this running joke. … (I explain again his hoax) ... But finally New Yok's numbers wouldn't fit - you were going to come explain how that was a huge lie, thought better of it and developed exhaustion. Please just stay exhausted, thanks."

In response, Mather's first reply to me: "wow - a troll - we see so few these days. Thank you for taking the time to reassure us they're not extinct" - nothing to rebut the facts.

What caused this natural exhaustion? I guessed New York fared far worse than anywhere else, so even his plotting trick could barely conceal the continued rise. It might even push past his 1 million mark into the 1-10 mil band he didn't even include previously. I converted some 1/3 of the daily totals to his units - cases per 100 million people. For a state of 19.5 mil, you times the case number by 5.128, so case #1 puts them at the 5 line. By that, on April 13 they broke the line of 1 million per 100 million, or 1% of New Yorkers confirmed infected. That was before he even looked, around the 20th, so he'd be dismayed and informed all at once. Here I compared my own plotting of nearly half the days (orange, labeled) on his diminishing scale, atop the first set of curves for UK, Italy, etc. This time I broke each line down about how he does, so I can plot it better (note: my graph or points got a bit messed up at the 100k line, so I fudged a smoother curve there only).

Even here it LOOKS like it's flattening just a bit higher and later than anywhere else. Mather could say it's mellowing, no help from lockdown, but ... when some 1.35% is confirmed as having it, maybe 3-10 times that many have had it, so many know someone who's died or came close or they can see hospitals overwhelmed, they might know it's taking about 7-800 dead per day, nearing 18k total. That's close to what all the UK has suffered in a little longer span. It's been steadily worsening, finally in recent days decreasing in its rate. People living in that (and there are a lot of them) just might balk if anyone tries to tell them "see, it's nearing exhaustion, just about to stop spreading. Why did you panic?" The people are closer to exhaustion than the virus, but most of them appreciate that - thanks to lockdown - it's not twice this bad or worse, like it could be.

Or - seeing it look flat on the computer screen isn't as convincing when you live the reality that 900,000 is just NOT the same thing as NINE.

postscript: maybe I provoked him, maybe he'll do the above, but he couldn't stay down even with this much blood potentially on his hands. But he had to come back with a longer video woking in New York ... ATM I'm too exhausted to even look, but …
CvFNF ChartUpdate Restored 200422a
https://www.youtube.com/watch?v=FXPBkwi1uvQ
One among the cult-like comments shows just the effect Mather hoped to have in the UK and now in New York City and the whole world with his epic hoax (and there might be legal proceedings, we'll see):