
Adam Larson (aka Caustic Logic)
January 22, 2021 (rough, incomplete)
edits Jan. 24/28
Genevieve Briand, favoring reporter Yani Gu, the woman in the cited video, are most welcome to contact me or dispute my reading - supporters of theirs can also try - I will go ahead and read and rip on this my own way in the field, as its fans have done - THEN I'll ask for any response from the ones I can name and contact. (maybe not today though). If they can clarify much by e-mail. I'll have to wonder why they couldn't do so before that.
---


Mrs. Briand's presentation and derivative materials have been eagerly cited by adoring fans as a hard truth sussed out by a JHU professor (and that's an esteemed school re:medical issues). But of course, in their view, it was retracted under political pressure, squashed by the elites to protect their big hoax. It's the most likely basis for any recent claims the US has witnessed no excess deaths - though both notions have been raised previously by others.
The American Institute for Economic Research has long favorable to any argument opposing lockdown and business restrictions, because they love freedom and they think they understand medicine well enough to meddle in public health debates, sponsoring a "Great Barrington declaration" favoring vaccine-free herd immunity as soon as possible, recklessly submitted to moron president Trump with his moron adviser Scott Atlas. (I say moron in lieu of evil). Ethan Yang wrote for them, summarizing the message he got from Briand's findings:
New Study Highlights Alleged Accounting Error Regarding Covid Deaths – AIER
"Deaths have remained relatively constant, yet reported deaths due to deadly conditions such as heart disease have fallen while reported Covid deaths have risen. This suggests that the current Covid death count is in some capacity relabeled deaths due to other ailments. ... The hysteria over Covid-19 has likely led to the alleged accounting error noted in Briand’s study, the reclassification of expected deaths from all causes into Covid deaths. That accounting error has likely led to a number of policy decisions that have drastically crippled our ability to support the general welfare of society, economically, socially, and spiritually. Going forward these findings should give us pause and reconsideration over the threat Covid-19 actually poses and realize how much avoidable damage we have done to ourselves as a result."
Matt Margolis, PJ Media, Nov. 27 UPDATED: Johns Hopkins Retracts Article Saying COVID-19 Has 'Relatively No Effect on Deaths' in U.S.
Reference material:
Original video presentation "Covid-19 Deaths: A Look at U.S. Data" - published by JHU Advanced Academic Programs, November 13, 2020 https://www.youtube.com/watch?v=3TKJN61aflI
Some later q&a with Briand: https://twitter.com/HricSchink/status/1332920820079857665
Review article in the JHU newsletter By Yanni Gu, November 27, 2020- since pulled - archive.org copy: https://web.archive.org/web/20201126163323/https://www.jhunewsletter.com/article/2020/11/a-closer-look-at-u-s-deaths-due-to-covid-19 - or compare with the copy shared by the newsletter itself as a PDF to cool accusations it was trying to silence or erase the article.
JHU rebuttals:
Quick explanation in place of the pulled article https://www.jhunewsletter.com/article/2020/11/a-closer-look-at-u-s-deaths-due-to-covid-19
Explanatory editorial: https://www.jhunewsletter.com/article/2020/12/on-the-retraction-of-a-closer-look-at-u-s-deaths-and-our-coverage-of-covid-19
A fuller explanation WHY Briand is wrong, citing several and more relevant JHU experts. https://www.jhunewsletter.com/article/2020/12/public-health-experts-and-biostatisticians-weigh-in-on-covid-19-deaths-a-look-at-u-s-data-webinar
From the first editorial: "The leadership of The News-Letter takes responsibility for this situation. The article shouldn’t have been published without the additional information needed to put Briand’s research into perspective." They're too polite. The proper perspective for this is in the toilet. It should never have been published. OR else its retarded ass needs to be babysat and explained for at every turn. Otherwise ... I'm for free speech in general, but consider what this says, from a "JHU expert," and now it was cited so eagerly. It will become easy fuel for hordes of dangerous idiots who will keep causing deaths, allowing the virus to breed like mad, and spawn deadly variants that much faster.
Steady Age Breakdown

First, let's consider how Briand addressed weekly deaths by age group in her popular figure 1 (see 12min in the video). This shows a breakdown for weekly all-causes deaths to week 32, broken down by color-coded age groups. She decides the percentage doesn't change over the weeks shown here when it should, as the elder-slaying Covid-19 entered the scene in March - ... "I would expect that percentage to go up during the weeks of peak covid-19 deaths, which are weeks 11-13 and we don't have that." the "chunks pretty much stay the same."
Actually weeks 15,16 and 17 are the spring peak of covid deaths, as Briand realizes at other points. So it it's not even clear why she was looking in a span 4 weeks earlier. But as it happens, this is the spot where her reading is the most wrong; just the time she claimed to see no rise - during the upswing to the peak, from w10-12, deaths of 85+ rise from about 30% to 33% before dipping back to 30 and then about 28% (the image below makes this more clear). And conversely, there's a slight decline in the percentage of younger people dying - under 54 drops about 2-3% in weeks 11-13 before rising a bit into the spring and summer. At week 11, 11% of deaths were aged 54 and under, and at w19 it peaked at 15%, then holds steady around 13%.
My addition: figure 1 flipped upside down to clarify what's a rise here, cropped on the 85+ bracket, and vertically stretched a bit to clarify the minor differences. Compared to curve of covid deaths lined up below it, the relevance seems clear to me. No change to reflect any major outbreak - really? 
Four points emerge:
1) Age proportion was never the main issue. It was the scale of deaths, actual and possible, that scared people, not the incredible oldness of them. But still, covid does have that age issue. It should appear, and apparently does. To the extent it's not as clear as it should be (?) ...
2) There were covid deaths from year's start and it seems even in late 2019, back to week 47 at least. So the age breakdown may be covid-distorted from the start, and a comparison with prior years' breakdowns might have been more useful to make her point.
3) If the age breakdown remains this steady, even as it applies to the enormous deaths of weeks 11-22, to the extent she's right and age proportions remain steady, she helps weaken the myth that covid only kills people in their 80s and up and thus isn't much of a danger to society. It means COVID-19 has always killed a wider age range than Briand was "told." She might find it surprising how many in their 30s and 40s and even 20s and younger have died from/with it.
Justin Lessler, an associate professor in the Department of Epidemiology at the JHU's School of Public Health (not economics) pointed out for the JHU newsletter:
“I see that the proportion [in Figure One] has not changed as evidence that we should not be seeing COVID-19 as a disease of just the very old because, in terms of relative risk of death, it is impacting all ages (or at least all adults) fairly equally... just what that raw number is, is quite different for each age,” he wrote. “If anything, I think [Figure One] is just a stark illustration that COVID-19 raises mortality risk in all age groups.”
Normal Seasonal Pattern
Around 20 minutes into the video, Briand shows the yearly seasonal variance of deaths between 2014 and 2020. She seems amazed to realize there's a yearly pattern with regular ups and downs, rising each winter to a peak between 60,000 and 70,000 deaths per week, usually in the second week of January, falling to about 50,000 over the summer, then rising again over the fall. She also learned some details of these winter spikes, including:
* it's mainly older people who die each time,
* they die from a mix of flu and pneumonia and resp. illness deaths and elevated deaths from heart disease, alzheimer disease and other causes
She doesn't seem to understand when or why this happens, but 2020 also has a rise and then a fall, is only so much higher than the next highest peak, and thus maybe just the normal thing.
Briand somehow choses 2017-18 as the best comparison year, rather than the prior season (2018/19), the one most likely to have a direct bearing on 2020's mortality situation. The year she picked does have the highest peak of deaths (around 68,000), and thus the best chance to call 2020 normal in comparison, or maybe even low in some useful way ... which she does.
The JHU News-Letter cited Emily Gurley, an associate scientist in the Department of Epidemiology at the School of Public Health (not economics), who "noted that the assessment in the webinar did not compare the same months in 2018 and 2020, leading to a flawed interpretation."
"Comparing winter months (Figure Three) to spring months (Figure Four), Gurley explained, does not account for seasonal variations; for instance, mortality due to most causes, including heart disease, declines in the spring. “She compares specific cause of death data from 2018 to 2020, but instead of comparing the same months in 2018 to 2020, she compares the time period where total mortality peaked each year,” she wrote. “In doing so, the presenter neglects the fact that COVID-19 deaths peaked in the spring, even though the usual seasonal patterns for other causes of death did not change.”
Lessler added that 2018 was a year with excess mortality, as echoed by the CDC, and noted flaws in focusing on only the peak in mortality of that year.
“2018 was a bad flu year, so she is comparing with a year that we already had some excess mortality. 2020 peaks in deaths are far higher than pretty much every other year,” he wrote. “Also, she makes a logical error in focusing only on the [2018 peak]. If you look at the CDC site you will notice [deaths in] 2018 exceeds the seasonally adjusted average for only 6 weeks, but [deaths in] 2020 exceeds the seasonal average for every week since March 28, 2020.”
Another Briand image with corrections added; we can see now steady the seasonal pattern is, always the same time to worst seasonal peak - underlining the centrality of week-to-same-week comparison, which Briand finds to be optional. She compares a seasonal peak that's the highest available to an off-pattern, post-peak super peak in 2020 that rises to some 23,000 deaths above the equivalent week in even in the high-mortality 2018.

Scott Zeger, a professor whose primary affiliation is with the Biostatistics Department at the JHU School of Public Health (not economics)
“Dr. Briand correctly points out the winter peaks in most causes of mortality. These are associated with respiratory infections that exacerbate many chronic conditions,” he wrote. “In the winter of 2019-2020, there is clear evidence of the expected seasonal peak that was then swamped by the COVID rise in the spring.
Robert Anderson, chief of the Mortality Statistics Branch of the National Center for Health Statistics, also disputes Briand’s analysis. According to Anderson, Briand didn’t account for seasonal changes in deaths. “In the spring of 2020, during a period where we normally should be seeing declining mortality, deaths continued to increase and were at unusually high levels through the spring,” he told Lead Stories. “So, the comparison of the most lethal weeks in 2018 with the most lethal weeks of 2020 is not appropriate.”
“In 2018, deaths followed the normal pattern (although at a higher level than normal). In 2020, deaths did not follow the normal pattern…they should have been declining in the spring, but instead increased substantially,” Anderson added.
Indeed, the standard is to compare same-week levels in different (usually adjacent) years, or better yet in average, or well-adjusted model. Skipping the differences in yearly mortality and comparing 2018 to 2020 using comparable weeks - the same graph Briand made shows week 15 peak is not 11,292 above the same week in 2018, but rather a bit over twice that - ~22,800 above expected by the usual pattern. or some 142% of the expected deaths around ~55,000 in week 15, 2018
Missing Heart Attack Deaths/Natural Causes Swap-Out
So Briand mistook the covid peak for the seasonal all-causes death peak, where all causes combine and, as she noticed, heart disease is usually in a solid lead. Even in 2020, it still led among non-covid causes, but Briand was stuck on the strange data suggesting Covid-19, at its peak, killed more than heart disease, for the first year in history. In fact, four weeks in a row it did this. She knows it usually kills way less - zero, in fact, because it never existed. Why should this year be so much different unless there's some deception afoot?
29:30 in the video: "those lines over there look weird to me." The parabolic curves of very large numbers gradually brought under control look strangely "smooth" compared to low-level wigglings of usual deaths - as if she's never encountered such an effect in her study of economics, or can't see a bit of it in every spike to the left in her same image?

But never mind just how "lumpy" the curves are, one of them is just way too big. "It looks as if the peak of covid deaths is HIGHER than the peak of heart attack deaths." She finds this amazing; as if she had video of Elvis' ghost, she implores the audience "you see that?"
Gu article: "COVID-19-related deaths exceeded deaths from heart disease. This was highly unusual since heart disease has always prevailed as the leading cause of deaths," Apparently she thinks it must always be the leading killer, no matter how lethal the competition. Like, if COVID-19 tried to kill more, even for one single week, heart attacks would by definition have to go on a real rampage to keep their pre-defined permanent leading role.
Of course that makes no sense. Covid is simply deadlier than heart disease, even when it's curtailed as it has been. It's even visible in a highly average view; the US totals include hard-hit areas and ones barely affected. Covid killed more than heart disease for 4 weeks straight at the spring peak. In the winter surge, it's killed more since week 47 (to Nov. 21), or at least six weeks in a row to week 52 (incomplete data after that).
When I was tracking Texas briefly in the summer, covid surpassed heart attack at least 6 weeks straight, peaking at near twice as many deaths. Note how h.d. itself and other causes - all known covid co-morbidities - were also seen rising at odd times. Spring, summer, winter of 2020 - all natural, seasonal spikes of all-cause deaths with missing heart attacks?

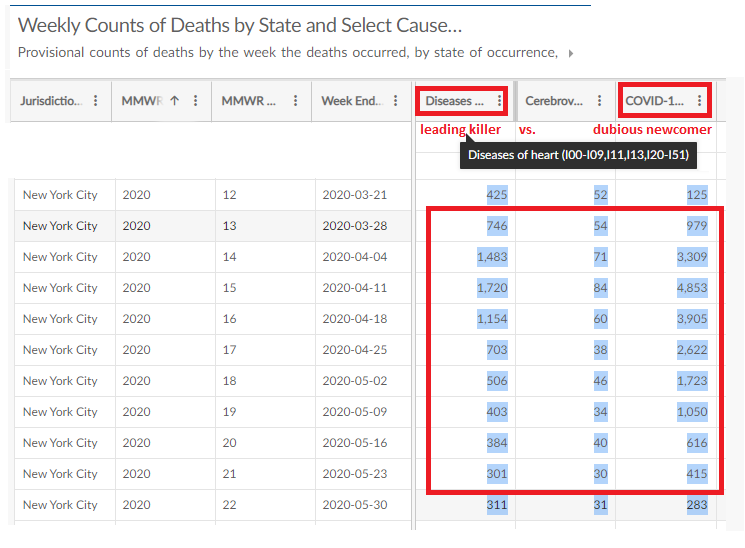
New York City, week 15: of 7,860 total deaths, at least 4,564 were caused by COVID-19. That's 58% - more than the 42% killed by all other causes combined. At the spring peak, covid surpassed heart for nine weeks straight, even with heart deaths seeing a strange surge just then (see compiled table). (CDC source, for this and much else in this article)
In parts of Italy, weekly deaths from COVID-19 were far more than heart disease and all other causes combined. I recall hearing Bergamo (IIRC) suffered up to 800% the normal mortality before the virus was reigned in. If so, that suggests the virus (and/or lockdown, etc. - something new) briefly killed 7x as many as all other causes combined. Don't quote me on that part, but it definitely can kill more than heart disease if allowed. (and some bonus questions: do we see NYC's share of missing heart deaths here? How many more were there supposed to be in those weeks, and why?)

But even a fraction of that known killing power seen in a U.S. average makes no sense to Briand. 31:30 "Hm? It doesn't make sense. Doesn't make sense at all." She has to ask "what's going on?" and "where have all the heart attacks gone?"
Comparing to the 2017-18 peak, she finds 367 fewer deaths than "expected" for the 2020 peak 2.25 years later. She marks this (narrow band) as "expected not seen," and then marks a much bigger gap between that and something up past 18,000, labeled +???. I guess she sees a natural spike just like 2018's but bigger for who knows why, and thinks HA should have led at super-peak levels, just naturally there in April. As I measure it, this shows some 3,090 more heart attacks that she (maybe ???) expected to see for that week. Her image with my notes added in mostly red, and explained below.


Finally, after mistaking the covid peak for the seasonal all-causes death peak, it seems she mistook the following seasonal decline (see above, added aqua-green matching curves) for a continued suspicious decrease into the summer. Prof. Scott Zeger: "The trough in non-COVID causes that Dr. Briand notes that spring is not a mis-attribution of non-COVID deaths to COVID. It is the natural spring abatement of the winter mortality rise that happens every year.” That may not be what she meant, but if so, he's right. I'll add the decline started from the elevated levels many have noted, was steepened by lockdowns and others measures that would limit the spread of all contagions that, as Zeger noted, cause the extra few deaths adding up to the winter spike. Also, that effect in turn is offset some by false covid inclusions that continue - especially into the summer, when "non-covid" excess deaths rise again contrary to usual trends.
But all these "missing" deaths, not just from heart attack, opened a big fake mystery. And it's not hard to solve - deaths don't disappear, once they're "expected." They simply must be in disguise, hidden in another category. 48min "[the published numbers] are somewhat misleading or some of them are going to be misleading, in that - the data show the number of heart attacks decreased during the peak of total deaths that we experienced, and heart attack is the leading cause of death in the United States. If [the numbers] were not misleading at all, what we should have observed is an increased number of heart attacks and also the increased COVID-19 numbers. But a decreased number of heart attacks - and all the other death causes - doesn’t give us a choice but to point to some re-classification. Not all of them" she hastened to add, just "some" unspecified portion of them.
She won't call the COVID-19 death toll entirely fake or even fake on purpose, but of course her readers, especially second-hand ones, just know that can't be an accident, and they're sure the portion of fakery is major or even total. The woman cited at the start understood it: "all they've done is recategorized all the deaths. This is not what they're telling us it is. It's a lie."
But there is no overall decline. Rather, 2020 saw a large excess of natural causes deaths. All those expected and more - at least 88,634 NON-COVID natural causes deaths above 2019 levels over a similar span to what Briand studied (to week 36, or 39, incomplete). This is on top of a bit over 200,000 confirmed covid deaths in the same span, all by definition above 2019 levels that were zero. See here for my graphs. Not that I've checked, but the same probably happened with the fall and winter spikes of covid deaths.
Briand and I have different expectations for 2020 partly because the best available comparison is not 2018 but 2019, with its smooth, low curve that can be seen flowing easily into 2020 (again, see aqua curves in the image above - they match each other AND the years quite well), but with some early covid-esque spikes. The real mortality baseline for 2020 aside from the virus, and lockdown etc. will be its own story, and things change - as this pandemic shows. But otherwise the change might have been small, so 2019 might be as good a comparison as a well-adjusted 5-year average, or even better.
The 2019-2020 flu season starts almost a copy of the last, by many signs even a bit lower in fatality aside from covid (not that it's easy to tell). Clearly above the baseline, there are some early bumps of possible relevance at week 39 and 47 of 2019, and a big and clear surge of definite covid deaths just after new year's, just a handful of which managed to be confirmed. Then there was a mild dip and a rise to the massive spike of mortality in the spring most of us have heard about, then another fat, low surge in summer, and we know bigger yet has followed since, growing from mid-autumn to the present (recent 7-day average 3,300 covid deaths per day in the U.S.). Officially, it's near 420,000 now confirmed killed.
Including mis-classified deaths behind those other n.c. excesses, the real toll so far might be some 40-50% higher. Wherever we can see, including all U.S. states, the "non-covid" excess deaths seem to mainly be yet more covid ones. The timing and scale, the similar age bracket, and the elevated causes (mostly known covid co-morbidities) all point to that. From there, lockdown etc. causes a decline in all transmissions - SARS-CoV2, influenza, other - and thus reduces external triggers for heart attacks, etc. which fall to low, seasonal levels, before rising again with the summer covid spike. (Scott Zeger: "the winter peaks ... are associated with respiratory infections that exacerbate many chronic conditions." And note COVID-19 is one of these). And as the JHU News-Letter explained "those with those underlying conditions are statistically more likely to be severely affected and die from the virus" Some of those who would have died of HA etc. died of covid instead, or the two combined. And as they probably realize, some will do that and have the covid part missed, explaining the strange increases. See US. flu-pneumonia deaths - spiking oddly after flu transmission had fallen - it'll be the pneumonia catoegory risen, and guess what they tend to call undiagnosed covid suffocation deaths?

Consider that in late 2019 and early 2020, zero percent of covid deaths were diagnosed properly, even though we now realize they were happening. That doesn't change entirely, not overnight or probably ever. In the first weeks, deaths from solo co-morbidities (heart, alzheimer, cerebrovascular, etc.) and undefined pneumonia were super-elevated. That's probably due to slim diagnosis of covid deaths, both direct and indirect (illness survived, but with exacerbated conditions leading to a swift death afterwards). But identification improved a good bit, and then mis-classified deaths fall (while remaining high) just as covid rises a bit more sharply. And the actual deaths also decline as the cause of them decreases.
Now back to the w15-17 decline: it seems there was a change in classification around early April, besides a peak of deaths in most places. In the United Kingdom, their Office of National Statistics issued a report that mentioned but also soft-pedaled the notion of missed covid deaths and a higher, hidden death toll. This report suggested it was unlikely for influenza-pneumonia (if not other causes) "since Week 14 (week ending 3 April 2020)," at which point they diagnosed more covid deaths and lone co-morbidity deaths (especially this one) declined proportionally. See plate showing the five leading causes of death, with week 14 marked. i/p at bottom falls clearly after that. Others fall or rise less sharply, then increase again, as covid deaths (probably including these) were still accelerating. Mainly, the lesson to draw from this is the change didn't affect most causes that much - they kept on being super-elevated with no real explanation. (it's not lockdown, or denied medical care - see link below)
https://libyancivilwar.blogspot.com/2020/10/covid-19s-evil-twin-lumpin-20.html

It seems a similar thing happened in the US too, just a bit later (see below). The very peak of natural causes deaths was week 15 ending April 11 (US system is offset a day from UK) with only a slight decline in week 16 - nc overall fall a bit as the major covid portion increases a bit. As shown below, the purple area shrinks. This is what that plate above showed in numerical form and missing key context; the fairly insane weeks before, when nc deaths were about 45% above normal. "the total decrease in deaths by other causes almost exactly equals the increase in deaths by COVID-19," as Briand said, at the decline between weeks 15 and 16, and perhaps for some other spot by coincidence, but NOT as an overall pattern. This is what Briand notices, and it proves what? Levels that insane couldn't last, especially with distancing and lockdowns reducing infection rates all over.

Does Mrs. Briand think there SHOULD have been ~23,000 n.c. deaths above 2019 levels in mid-April, for no reason that can make sense - and since there aren't, 16,000 being rebranded as COVID-19 - or whatever portion of them she means (+3,090???)? In fact it was a suspicious presence of elevated deaths, seen being reduced but not eliminated in weeks 15-17. And she never asks where that elevation came from, taking it as natural, due to that clear seasonal pattern, comparable numbers, steady age breakdown, etc.
Here's your missing hart attack deaths - actually over-abundant all year long, compared to same-week levels in the best example year of 2019. “If [the COVID-19 death toll] was not misleading at all, what we should have observed is an increased number of heart attacks and increased COVID-19 numbers." She doesn't even get why that's true, but it happens to be. And it is observed, so what's the deal? She somehow didn't observe.

I've boxed in red the span where program director Briand notes the suspicious decline in weeks 15-17. If you ask yourself WHY these weeks each see a decline from the previous week, instead of rising higher yet to stay ahead of the ongoing covid rise ... the answer is because that only makes sense. How they ever got to that week 15 high is the real mystery Briand ignores, pretending THAT was the normal part of a seasonal death spike that's only 13 weeks late.
And this is why she decided on missing heart attack deaths. The fact that she claims to have found them somewhere else when they were never missing just adds to the embarrassment.
"Normal Death Numbers" & Conclusion
Briand and company found "no evidence that COVID-19 created any excess deaths. Total death numbers are not above normal death numbers. We found no evidence to the contrary." They didn't find this, or found it wrong. If the latter, and the circular nonsense provided so far IS the explanation, well... that was a big fail. (updated from initial tweet - she was referring only to the span including the first two waves) https://twitter.com/CL4Syr/status/1338522626973523968

Matt Margolis seemingly noted this disconnect: "So, if COVID-19 has actually had no significant impact on U.S. deaths, why does it not appear that way? To answer that question, Briand shifted her focus..." to the kinds of details addressed above, and simply left the disconnect unexplained. That seems to have worked for a lot of people. But the main problem they SHOULD be stumbling over more is the death toll is clearly NOT low, or normal, or even close. Briand either doesn't realize this, or has issued a very poor challenge to the agreed fact; she disputes the official numbers provided by state governments, as tallied by the CDC, but so far gives no good reason. This, even as she relies on misreading OF those numbers AS valid, to find factual "data" to question their ultimate validity - and thus any work like her own based on it.
Emily Gurley told the JHU News-Letter "that because Briand’s presentation does not specifically examine excess deaths, her conclusions are flawed. “Researchers (from both within the CDC and outside) have already analyzed data on vital statistics to show that >300,000 deaths have occurred in 2020 than occurred during the same time in other recent years (after accounting for changes in the size and age of the population),” Gurley wrote."
And Sourya Shrestha, a research associate in the Department of Epidemiology at the School of Public Health (again, not economics), "elaborated on the standard method used to calculate excess deaths. He asserted that comparing death counts week-to-week as Briand did fails to account for two important considerations: random fluctuations and seasonal trends. “A more robust way [to calculate excess deaths] is to construct a baseline of expected deaths using trends from past data and compare that to the observed deaths,” he said in an interview with The News-Letter." He describes the method used by the CDC ...
"The Morbidity and Mortality Weekly Report, published on Oct. 23, reported that 299,028 excess deaths occurred from Jan. 26 to Oct. 3. About two-thirds of those deaths were attributed to COVID-19. Other peer-reviewed papers have reported similar findings." (and I'll add at least a majority of the other 1/3 are suspect)
Gurley noted that the data presented in the webinar failed to address these statistics and did not demonstrate that officially reported numbers were wrong. “There are no data in this presentation that show that previous reports on the magnitude of deaths from COVID-19 are incorrect,” Gurley wrote.
---
bonus: From the twitter Q&A, Briand arguing that 2020 deaths were not just normal but a bit low. Agaian, she picks absurd expectations, and dashes them with the help of some bad math, so she can make another case for mass fakery.
Briand's 2019 deaths: 2,852,609 vs. my tally from possibly revised numbers: 2,791,887
Briand 2020:
* expected by year's end: 2,894,771 vs. 3,349,566 incomplete final tally when I looked (from here, careful tally of weeks)
* expected by 9/31 (week 39/40): 2,880,717 vs. 2,436,055/2,494,251 as logged now
** vs. seen then 2,402,953 (even more "less than expected!")
** vs. 2019 through w39, ending 9/28: 2,123,698 (a decent basis NOT to expect 2.88 million as normal for the following year)
* expected w41-52 (to year's end minus to 9/31): 14,054. This is about one week's deaths, not three months' worth. vs. 855,315 actually logged, still a bit incomplete.
* Why less deaths? She doesn't know. Maybe less traffic accidents? No. That's a tiny class of deaths - not sure, maybe 1-2% of the total, cut by maybe 1/3 on average. Suicides are a bigger class yet, and alcohol/drug OD bigger yet, and both of these were elevated in 2020 (some of those "lockdown deaths" that do exist). Those would more than offset any such decline in deaths from external (un-natural) causes. Exact numbers aside, even these are small compared to any leading natural cause, tiny compared to what COVID-19 has done, and miniscule compared to what it could have done if left un-checked.